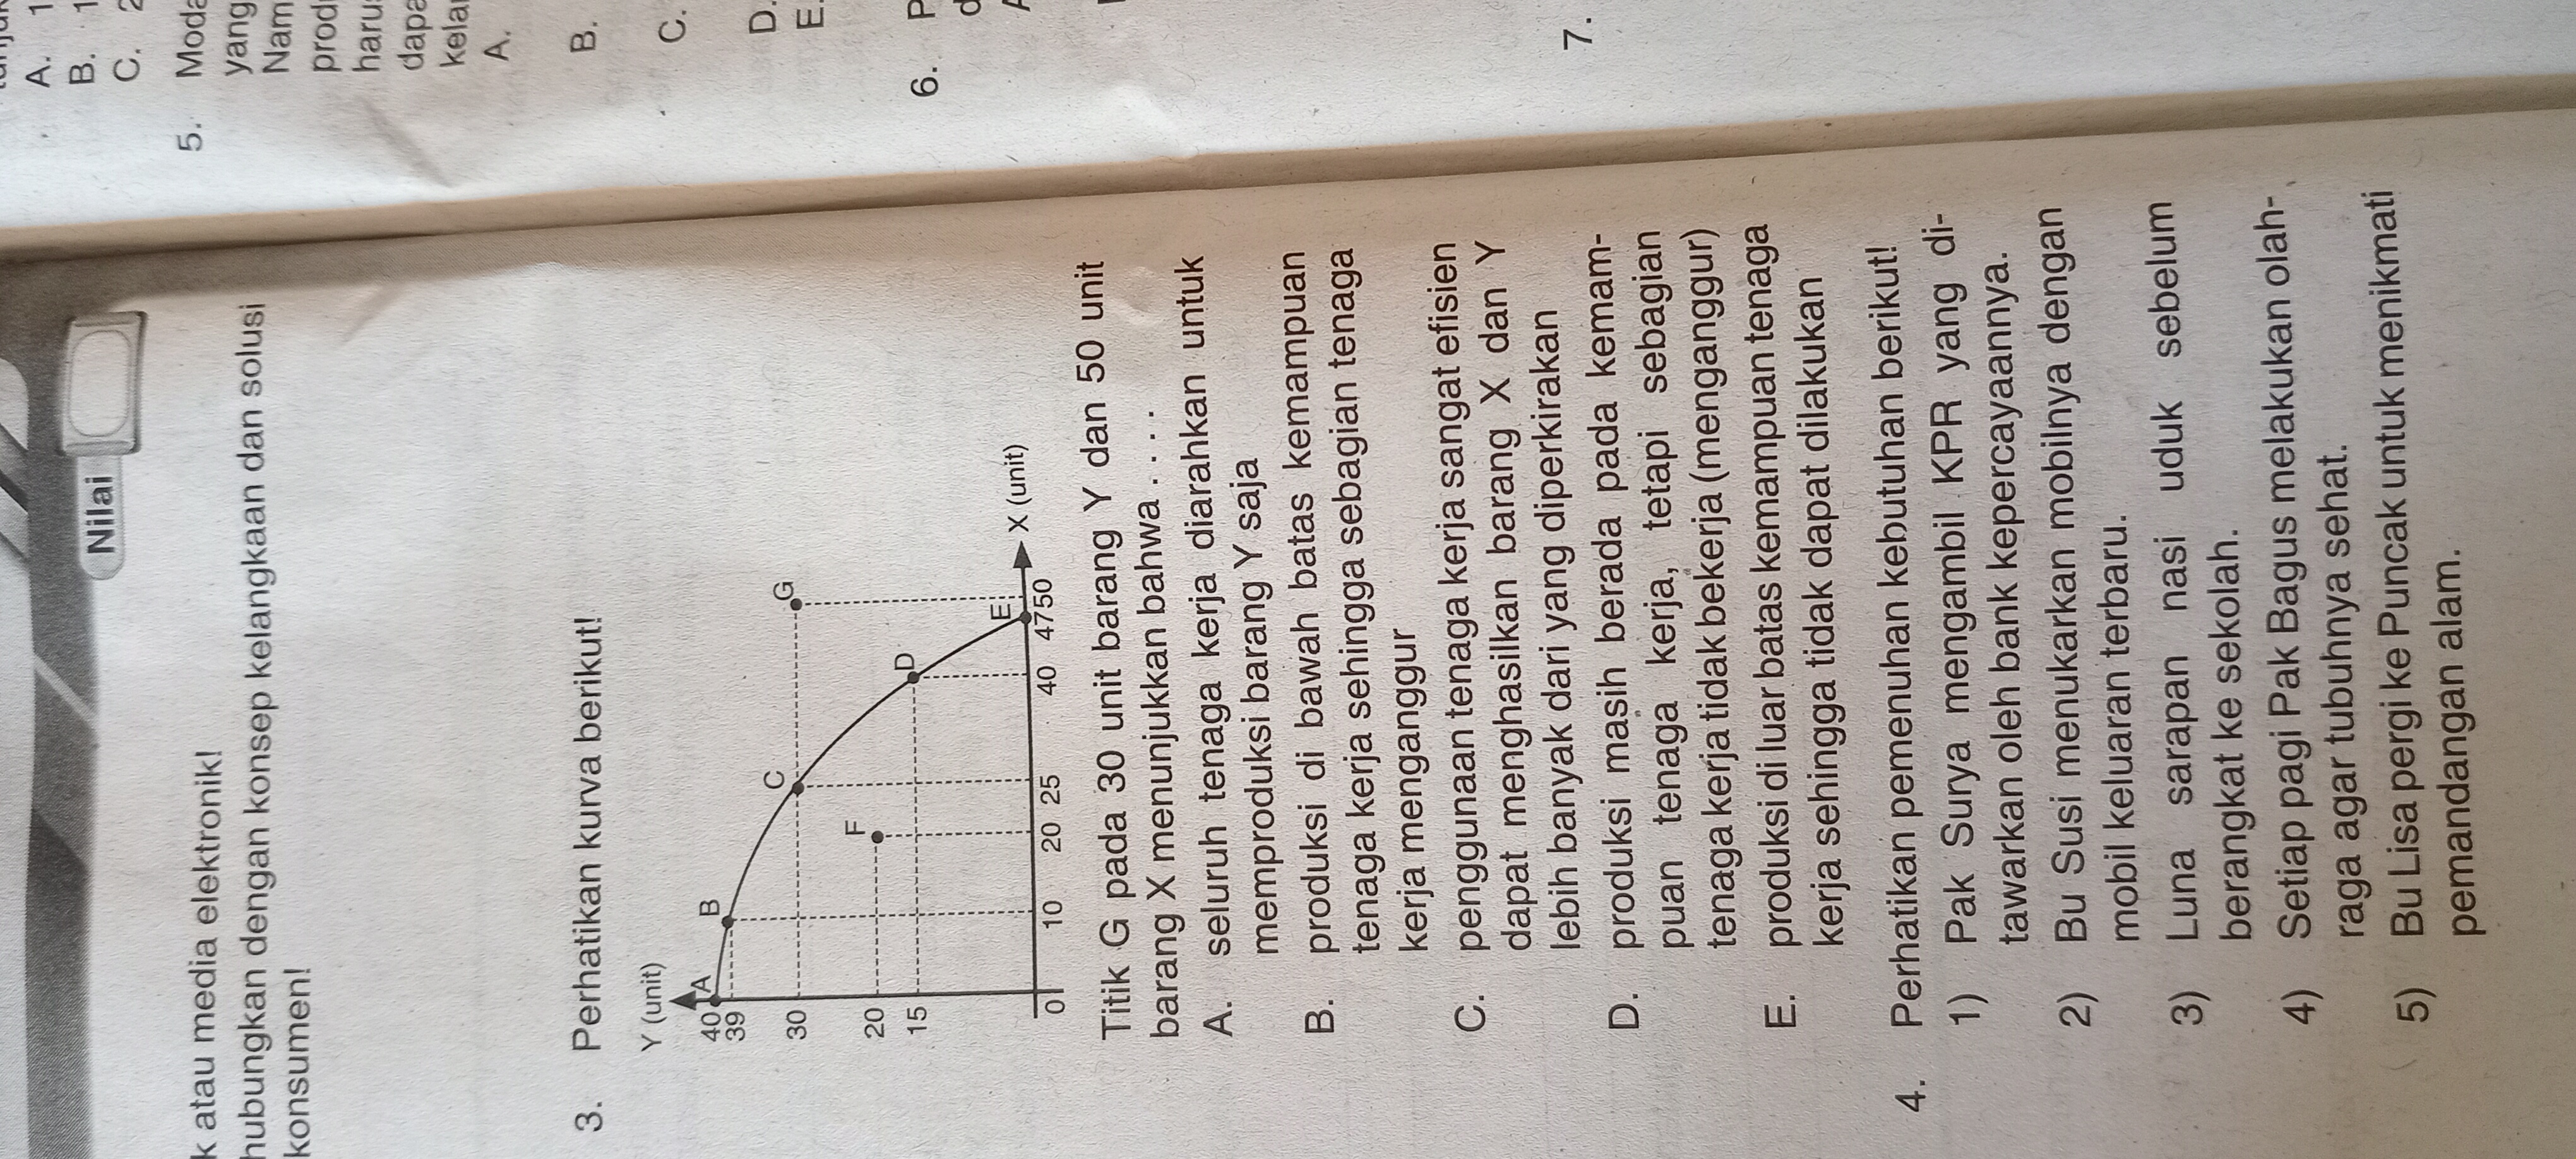
3 Perhatikan kurva berikut Y unit 40 TA 39 B C G 30 20 15 D E X unit 10 20 25 40 4750 Titik G pada 30 unit barang Y dan 50 unit barang X menunjukkan bahwa A seluruh tenaga kerja diarahkan untuk...
Question
Jawab
Basic Answer
Step 1: Analyze the graph
The graph shows a Production Possibility Frontier (PPF). Point G (30 units of Y, 50 units of X) lies inside the curve.
Step 2: Interpret Point G’s position
A point inside the PPF indicates that the economy is not producing at its full potential. Resources, including labor, are underutilized.
Step 3: Evaluate the options
Option A is incorrect because point G shows production of both X and Y.
Option B correctly states that production is below the capacity, implying some unemployment.
Option C is incorrect; efficiency would be represented by a point on the curve.
Option D is partially correct in that some labor is unemployed, but it’s not about the capacity of labor, but rather the utilization of it.
Option E is incorrect; production is within the capacity.
Final Answer
B. produksi di bawah batas kemampuan tenaga kerja sehingga sebagian tenaga kerja menganggur (Production is below the capacity of the workforce, so some labor is unemployed).